 Discover what moves you
Photography on requestFor sale
Residence PH88
$88,500,000
4 bd | 7 ba | 8,200 sq ft | $10,793/sf
Est. rebate $531,000*
Courtesy of Compass
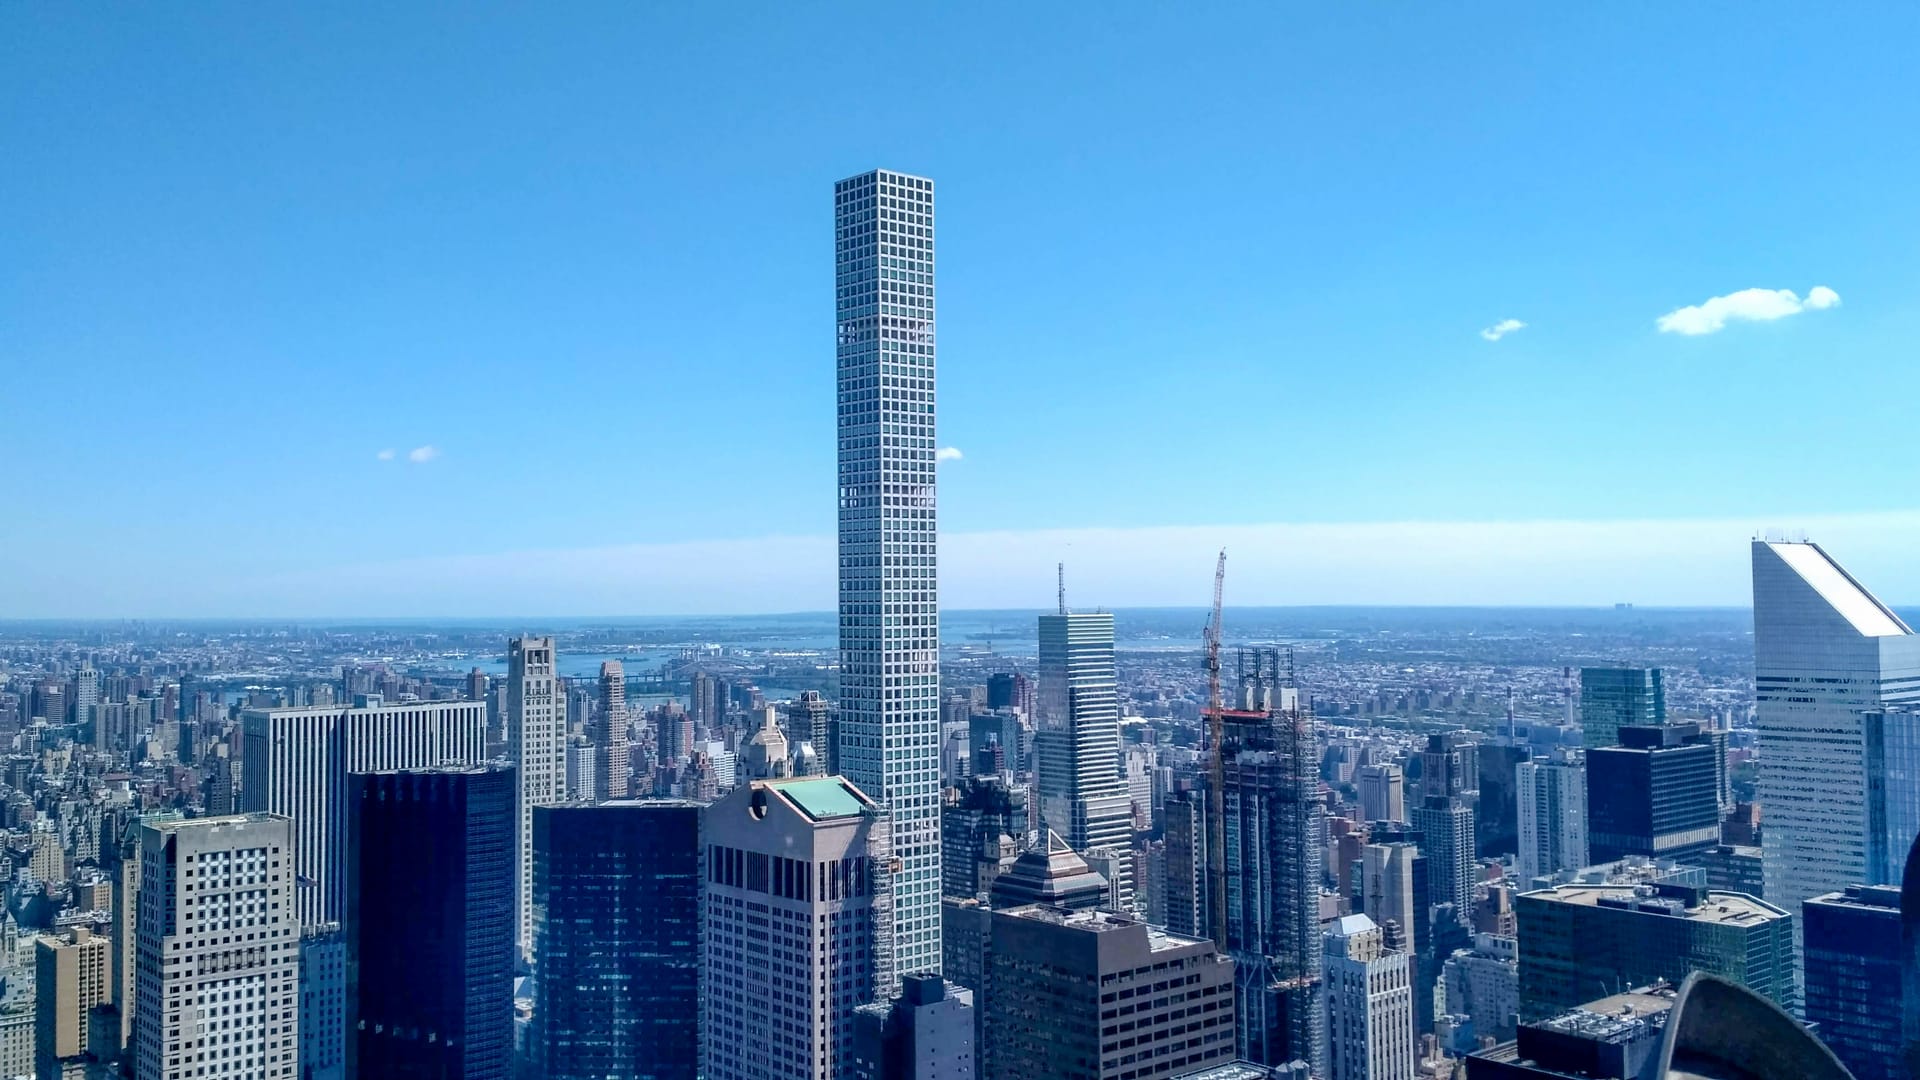
Rafael Viñoly's 1,396-foot column of white concrete on Park Avenue at 57th Street, completed in 2015.
Last updated | Sources: NYC ACRIS recorded deeds, NYC DOF roll, REBNY RLS | Markdown version
Rising 1,396 feet above Park Avenue at 57th Street, 432 Park Avenue was designed by Rafael Viñoly as a slender square column of exposed white concrete, its facade a strict grid of identical 10-by-10-foot windows. The tower is organized in stacked 12-story blocks separated by open two-story mechanical floors that let the wind pass through the building. Residences occupy full or half floors, with ceilings of about 12.5 feet and views in every direction over Central Park, both rivers and the Midtown skyline. Interiors were designed by Deborah Berke with Bentel & Bentel.
| Residence | Price | $/SF | Bd / Ba | Sq ft | Monthly carry | Est. rebate* | Plan | |
|---|---|---|---|---|---|---|---|---|
| For saleCourtesy of Compass | $88,500,000 | $10,793 | 4 / 7 | 8,200 | $50,165CC $34,405 + tax $15,760 | $531,000 | — | |
| For saleCourtesy of Douglas Elliman Real Estate | $80,000,000 | $9,953 | 4 / 6 | 8,038 | $34,000CC $34,000 (tax n/a) | $480,000 | — | |
| For saleCourtesy of Douglas Elliman Real Estate | $67,000,000 | $12,359 | 3 / 4 | 5,421 | $23,156CC $23,156 (tax n/a) | $402,000 | Plan | |
| For saleCombination of 71A + 71BCourtesy of Corcoran Group | $64,000,000 | $7,893 | 8 / 8 | 8,108 | $39,614CC $25,230 + tax $14,384 | $384,000 | — | |
| For saleCourtesy of Corcoran Group | $32,000,000 | $7,962 | 4 / 5 | 4,019 | $19,807CC $12,615 + tax $7,192 | $192,000 | Plan | |
| For saleCourtesy of Corcoran Group | $32,000,000 | $7,962 | 4 / 5 | 4,019 | $19,807CC $12,615 + tax $7,192 | $192,000 | Plan | |
| For saleCourtesy of Douglas Elliman Real Estate | $22,995,000 | $5,722 | 4 / 5 | 4,019 | $12,615CC $12,615 (tax n/a) | $137,970 | Plan | |
| For saleCourtesy of Modlin Group LLC | $22,800,000 | $6,419 | 2 / 4 | 3,552 | $39,006CC $31,761 + tax $7,245 | $136,800 | Plan | |
| For saleCourtesy of Douglas Elliman Real Estate | $16,950,000 | $6,438 | 3 / 3 | 2,633 | $11,247CC $11,247 (tax n/a) | $101,700 | Plan | |
| For saleCourtesy of Corcoran Group | $15,000,000 | $3,747 | 4 / 5 | 4,003 | $19,727CC $12,565 + tax $7,162 | $90,000 | Plan | |
| For saleCourtesy of Compass | $8,995,000 | $4,045 | 3 / 3 | 2,224 | $14,006CC $9,500 + tax $4,506 | $53,970 | Plan | |
| For saleCourtesy of Peter Ashe | $7,800,000 | $3,714 | 2 / 3 | 2,100 | $13,222CC $8,968 + tax $4,254 | $46,800 | Plan | |
| For rentCourtesy of Douglas Elliman Real Estate | $75,000/mo | — | 3 / 3 | 2,633 | — | n/a, rental | Plan |
Live from the REBNY Listing Service (RLS) via Cotality, Oct 2026. Listing courtesy of: Compass, Douglas Elliman Real Estate, Corcoran Group, Modlin Group LLC, Peter Ashe. Monthly carry = common charges + real estate taxes as reported on the listing.
| Closed | Residence | Price | $/SF | Bd / Ba | Sq ft | Rebate at price* | Plan | |
|---|---|---|---|---|---|---|---|---|
| Jul 2026 | $22,000,000 | $5,567 | — / — | 3,952 | $132,000 | — | ||
| Mar 2026 | $8,697,500 | $3,911 | 2 / 2.5 | 2,224 | $52,185 | Plan | ||
| Aug 2025 | $14,650,000 | $4,097 | 3 / 3.5 | 3,576 | $87,900 | — | ||
| Dec 2024 | $7,225,000 | $3,440 | 2 / 2.5 | 2,100 | $43,350 | Plan | ||
| Oct 2024 | $3,021,035excluded from charts | — | 2 / 2.5 | 2,029 | — | |||
| Jul 2024 | $10,700,000 | $2,673 | 3 / 4.5 | 4,003 | $64,200 | Plan | ||
| Jul 2024 | $1,350,000 | $3,947 | — / — | 342 | — | |||
| Jun 2024 | First sale | $11,293,071 | $2,821 | 3 / 4.5 | 4,003 | $67,758 | Plan | |
| May 2024 | $13,500,000 | $5,127 | — / — | 2,633 | $81,000 | — | ||
| Mar 2024 | $1,600,000 | $2,930 | 1 / 1 | 546 | — | |||
| Mar 2024 | $24,990,000 | $6,218 | 4 / 4.5 | 4,019 | $149,940 | Plan | ||
| Mar 2024 | $1,510,000 | $2,766 | — / — | 546 | — | |||
| Feb 2024 | $7,568,000 | $4,230 | 2 / 2 | 1,789 | $45,408 | Plan | ||
| Nov 2023 | First sale | $12,593,070 | $3,146 | 3 / 4.5 | 4,003 | $75,558 | Plan | |
| Oct 2023 | $1,500,000 | $3,563 | Studio / 1 | 421 | — | |||
| Oct 2023 | $65,600,000 | $8,144 | 5 / 6 | 8,055 | $393,600 | Plan | ||
| Oct 2023 | $1,900,300 | $3,100 | — / — | 613 | — | |||
| Oct 2023 | $1,825,000 | $4,753 | — / — | 384 | — | |||
| Sep 2023 | $22,500,000 | $5,598 | 3 / 4.5 | 4,019 | $135,000 | Plan | ||
| Jul 2023 | $9,300,000 | $4,182 | 3 / 3 | 2,224 | $55,800 | — | ||
| May 2022 | First sale | $14,691,061 | $8,703 | — / — | 1,688 | $88,146 | — | |
| May 2022 | First sale | $31,990,505 | $5,025 | — / — | 6,366 | $191,943 | — | |
| May 2022 | $514,868excluded from charts | — | — / — | 535 | — | |||
| Dec 2021 | $4,500,000 | $3,165 | 2 / 1.5 | 1,422 | $27,000 | Plan | ||
| Nov 2021 | $26,000,000 | $6,469 | 4 / 4.5 | 4,019 | $156,000 | — | ||
| Aug 2021 | $19,100,000 | $7,254 | 3 / 3 | 2,633 | $114,600 | Plan | ||
| Jul 2021 | $1,250,000 | $2,101 | — / — | 595 | — | |||
| Jan 2021 | $13,000,000 | $3,248 | 3 / 4.5 | 4,003 | $78,000 | Plan | ||
| Jan 2021 | First sale | $19,768,295 | $2,469 | 5 / 6.5 | 8,006 | $118,610 | — | |
| Sep 2020 | First sale | $1,606,461 | $2,621 | — / — | 613 | — | ||
| Jun 2020 | $800,000excluded from charts | — | — / — | 546 | — | |||
| Jun 2020 | $237,451excluded from charts | — | — / — | 1,306 | — | |||
| Jan 2020 | $22,650,000 | $5,636 | — / — | 4,019 | $135,900 | — | ||
| Dec 2019 | $23,980,000 | $5,967 | 3 / 4.5 | 4,019 | $143,880 | Plan | ||
| Oct 2019 | $1,700,000 | $2,819 | — / — | 603 | — | |||
| Jun 2019 | First sale | $14,995,803 | $3,361 | — / — | 4,462 | $89,975 | — | |
| Jun 2019 | First sale | $31,501,890 | $7,971 | — / — | 3,952 | $189,011 | — | |
| Jun 2019 | First sale | $29,543,233 | $7,334 | — / — | 4,028 | $177,259 | — | |
| Jun 2019 | $10,785,833 | $6,029 | 2 / 2.5 | 1,789 | $64,715 | Plan | ||
| Jun 2019 | $15,750,000 | $3,935 | 3 / 4.5 | 4,003 | $94,500 | Plan | ||
| Apr 2019 | $19,603,872 | $4,425 | — / — | 4,430 | $117,623 | — | ||
| Apr 2019 | First sale | $16,939,575 | $4,737 | — / — | 3,576 | $101,637 | — | |
| Apr 2019 | $17,503,718 | $4,895 | — / — | 3,576 | $105,022 | — | ||
| Feb 2019 | $15,000,000 | $3,747 | 4 / 4.5 | 4,003 | $90,000 | Plan | ||
| Jan 2019 | First sale | $30,691,657 | $7,766 | — / — | 3,952 | $184,150 | — | |
| Dec 2018 | First sale | $30,191,920 | $7,592 | — / — | 3,977 | $181,152 | — | |
| Dec 2018 | First sale | $29,513,458 | $7,327 | — / — | 4,028 | $177,081 | — | |
| Dec 2018 | $5,000,000 | $3,516 | — / — | 1,422 | $30,000 | — | ||
| Dec 2018 | First sale | $15,073,646 | $4,216 | — / — | 3,575 | $90,442 | — | |
| Nov 2018 | First sale | $15,443,814 | $3,783 | 3 / 5 | 4,082 | $92,663 | Plan | |
| Oct 2018 | $15,074,335excluded from charts | — | 3 / 4 | 546 | — | |||
| Oct 2018 | $10,750,000 | $6,009 | 2 / 2.5 | 1,789 | $64,500 | Plan | ||
| Jul 2018 | First sale | $30,798,330 | $7,793 | — / — | 3,952 | $184,790 | — | |
| Jul 2018 | $24,200,000 | $6,021 | 4 / 4.5 | 4,019 | $145,200 | — | ||
| Jul 2018 | First sale | $1,322,639 | $3,142 | — / — | 421 | — | ||
| Jun 2018 | $1,775,000 | $2,944 | — / — | 603 | — | |||
| May 2018 | $25,250,000 | $6,283 | 4 / 4.5 | 4,019 | $151,500 | Plan | ||
| May 2018 | $34,750,000 | $8,646 | 4 / 4.5 | 4,019 | $208,500 | Plan | ||
| May 2018 | $10,950,000 | $6,121 | 2 / 2.5 | 1,789 | $65,700 | Plan | ||
| Apr 2018 | $22,000,000 | $2,732 | — / — | 8,054 | $132,000 | — | ||
| Apr 2018 | $42,000,000 | $7,748 | 4 / 6 | 5,421 | $252,000 | Plan | ||
| Mar 2018 | First sale | $32,422,270 | $8,152 | — / — | 3,977 | $194,534 | — | |
| Feb 2018 | First sale | $15,316,716 | $3,826 | 3 / 4.5 | 4,003 | $91,900 | Plan | |
| Dec 2017 | First sale | $1,316,791 | $3,752 | — / — | 351 | — | ||
| Dec 2017 | $8,180,000 | $3,678 | 3 / 3 | 2,224 | $49,080 | Plan | ||
| Dec 2017 | $1,620,000 | $4,219 | — / — | 384 | — | |||
| Dec 2017 | $26,436,176 | $6,578 | 3 / 4.5 | 4,019 | $158,617 | Plan | ||
| Dec 2017 | First sale | $1,865,210 | $3,135 | — / — | 595 | — | ||
| Dec 2017 | First sale | $15,622,191 | $3,903 | 3 / 5 | 4,003 | $93,733 | — | |
| Nov 2017 | First sale | $14,907,383 | $4,170 | — / — | 3,575 | $89,444 | — | |
| Nov 2017 | First sale | $1,713,233 | $3,138 | 1 / 1 | 546 | — | ||
| Sep 2017 | First sale | $39,337,141 | $7,256 | 4 / 6 | 5,421 | $236,023 | Plan | |
| Sep 2017 | $27,889,868 | $6,940 | 3 / 4.5 | 4,019 | $167,339 | Plan | ||
| Aug 2017 | First sale | $4,914,989 | $3,456 | 2 / 1.5 | 1,422 | $29,490 | Plan | |
| Aug 2017 | First sale | $37,745,776 | $6,963 | 4 / 6 | 5,421 | $226,475 | Plan | |
| Aug 2017 | First sale | $1,627,216 | $3,865 | — / — | 421 | — | ||
| Jul 2017 | First sale | $17,348,622 | $4,853 | — / — | 3,575 | $104,092 | — | |
| Jun 2017 | First sale | $1,449,983 | $3,826 | — / — | 379 | — | ||
| Jun 2017 | First sale | $32,712,458 | $8,121 | 3 / 4.5 | 4,028 | $196,275 | Plan | |
| May 2017 | First sale | $44,606,623 | $8,228 | 3 / 3.5 | 5,421 | $267,640 | Plan | |
| Mar 2017 | First sale | $16,489,758 | $4,119 | 3 / 5 | 4,003 | $98,939 | Plan | |
| Mar 2017 | First sale | $65,163,580 | $8,090 | — / — | 8,055 | $390,981 | — | |
| Feb 2017 | First sale | $14,303,393 | $3,206 | — / — | 4,462 | $85,820 | — | |
| Jan 2017 | First sale | $65,661,755 | $8,152 | — / — | 8,055 | $393,971 | — | |
| Dec 2016 | First sale | $23,874,943 | $5,351 | — / — | 4,462 | $143,250 | — | |
| Dec 2016 | First sale | $17,137,683 | $4,794 | — / — | 3,575 | $102,826 | — | |
| Dec 2016 | First sale | $2,942,761 | $4,880 | — / — | 603 | — | ||
| Dec 2016 | First sale | $29,042,363 | $7,226 | 4 / 4.5 | 4,019 | $174,254 | Plan | |
| Nov 2016 | First sale | $60,893,873 | $7,560 | — / — | 8,055 | $365,363 | — | |
| Nov 2016 | First sale | $1,321,344 | $3,765 | — / — | 351 | — | ||
| Oct 2016 | First sale | $30,951,145 | $7,701 | — / — | 4,019 | $185,707 | — | |
| Oct 2016 | First sale | $31,466,270 | $7,829 | — / — | 4,019 | $188,798 | — | |
| Oct 2016 | First sale | $32,881,795 | $8,163 | — / — | 4,028 | $197,291 | — | |
| Oct 2016 | First sale | $30,122,242 | $7,495 | 3 / 4 | 4,019 | $180,733 | Plan | |
| Oct 2016 | First sale | $1,490,726 | $3,923 | — / — | 380 | — | ||
| Oct 2016 | First sale | $21,150,780 | $4,774 | — / — | 4,430 | $126,905 | — | |
| Oct 2016 | First sale | $18,967,711 | $7,204 | 3 / 3 | 2,633 | $113,806 | Plan | |
| Sep 2016 | First sale | $19,629,468 | $2,437 | — / — | 8,054 | $117,777 | — | |
| Sep 2016 | First sale | $21,156,843 | $8,035 | 3 / 3 | 2,633 | $126,941 | Plan | |
| Sep 2016 | First sale | $1,673,733 | $3,065 | — / — | 546 | — | ||
| Sep 2016 | First sale | $1,531,483 | $3,988 | — / — | 384 | — | ||
| Sep 2016 | First sale | $87,660,898 | $10,619 | — / — | 8,255 | $525,965 | — | |
| Sep 2016 | First sale | $18,572,987 | $2,306 | — / — | 8,054 | $111,438 | — | |
| Sep 2016 | First sale | $43,329,149 | $7,993 | — / — | 5,421 | $259,975 | — | |
| Sep 2016 | First sale | $27,128,425 | $6,750 | 4 / 4.5 | 4,019 | $162,771 | — | |
| Sep 2016 | First sale | $1,568,140 | $4,084 | — / — | 384 | — | ||
| Sep 2016 | First sale | $1,161,803 | $3,065 | — / — | 379 | — | ||
| Sep 2016 | First sale | $1,048,383 | $3,065 | — / — | 342 | — | ||
| Sep 2016 | First sale | $1,941,536 | $3,167 | — / — | 613 | — | ||
| Sep 2016 | First sale | $1,862,414 | $4,850 | — / — | 384 | — | ||
| Aug 2016 | First sale | $28,002,017 | $6,967 | — / — | 4,019 | $168,012 | — | |
| Aug 2016 | First sale | $1,290,552 | $3,065 | Studio / 1 | 421 | — | ||
| Aug 2016 | First sale | $21,389,503 | $8,124 | — / — | 2,633 | $128,337 | — | |
| Aug 2016 | First sale | $14,265,724 | $3,197 | — / — | 4,462 | $85,594 | — | |
| Aug 2016 | First sale | $1,885,247 | $3,065 | — / — | 615 | — | ||
| Aug 2016 | First sale | $39,260,591 | $7,242 | 4 / 6 | 5,421 | $235,564 | Plan | |
| Aug 2016 | First sale | $18,983,098 | $4,650 | — / — | 4,082 | $113,899 | — | |
| Aug 2016 | First sale | $31,840,509 | $7,922 | — / — | 4,019 | $191,043 | — | |
| Jul 2016 | First sale | $30,081,350 | $7,485 | 3 / 5 | 4,019 | $180,488 | — | |
| Jul 2016 | First sale | $21,990,658 | $4,964 | — / — | 4,430 | $131,944 | — | |
| Jul 2016 | First sale | $31,608,725 | $7,865 | — / — | 4,019 | $189,652 | — | |
| Jul 2016 | First sale | $18,851,773 | $4,691 | — / — | 4,019 | $113,111 | — | |
| Jun 2016 | First sale | $27,042,204 | $6,729 | 3 / 4.5 | 4,019 | $162,253 | Plan | |
| Jun 2016 | First sale | $18,442,956 | $4,589 | — / — | 4,019 | $110,658 | — | |
| Jun 2016 | First sale | $14,588,322 | $3,269 | — / — | 4,462 | $87,530 | — | |
| Jun 2016 | First sale | $14,425,402 | $3,233 | — / — | 4,462 | $86,552 | — | |
| May 2016 | First sale | $28,890,482 | $7,188 | 4 / 4.5 | 4,019 | $173,343 | Plan | |
| May 2016 | First sale | $59,144,632 | $7,343 | 5 / 6 | 8,055 | $354,868 | Plan | |
| May 2016 | First sale | $24,990,100 | $6,218 | — / — | 4,019 | $149,941 | — | |
| May 2016 | First sale | $20,870,583 | $4,711 | — / — | 4,430 | $125,223 | — | |
| May 2016 | First sale | $27,507,062 | $6,844 | 4 / 4.5 | 4,019 | $165,042 | — | |
| May 2016 | First sale | $21,430,621 | $4,838 | — / — | 4,430 | $128,584 | — | |
| May 2016 | First sale | $9,849,983 | $4,429 | 2 / 2.5 | 2,224 | $59,100 | Plan | |
| May 2016 | First sale | $21,060,740 | $4,754 | — / — | 4,430 | $126,364 | — | |
| Apr 2016 | First sale | $28,146,837 | $7,003 | — / — | 4,019 | $168,881 | — | |
| Apr 2016 | First sale | $7,852,706 | $3,739 | 2 / 2.5 | 2,100 | $47,116 | Plan | |
| Apr 2016 | First sale | $7,273,721 | $3,271 | 3 / 3 | 2,224 | $43,642 | Plan | |
| Apr 2016 | First sale | $9,238,944 | $4,154 | — / — | 2,224 | $55,434 | — | |
| Apr 2016 | First sale | $7,966,131 | $3,582 | 3 / 3 | 2,224 | $47,797 | Plan | |
| Apr 2016 | First sale | $7,803,301 | $3,509 | — / — | 2,224 | $46,820 | — | |
| Apr 2016 | First sale | $9,646,333 | $4,337 | 3 / 3 | 2,224 | $57,878 | — | |
| Mar 2016 | First sale | $44,833,409 | $5,578 | — / — | 8,038 | $269,000 | — | |
| Mar 2016 | First sale | $15,003,613 | $3,733 | — / — | 4,019 | $90,022 | — | |
| Mar 2016 | First sale | $30,951,145 | $7,701 | 4 / 4.5 | 4,019 | $185,707 | Plan | |
| Mar 2016 | First sale | $24,582,962 | $6,117 | 3 / 4.5 | 4,019 | $147,498 | Plan | |
| Mar 2016 | First sale | $26,619,462 | $6,623 | 4 / 4.5 | 4,019 | $159,717 | Plan | |
| Mar 2016 | First sale | $25,601,212 | $6,370 | 4 / 4.5 | 4,019 | $153,607 | — | |
| Mar 2016 | First sale | $1,848,487 | $3,065 | — / — | 603 | — | ||
| Mar 2016 | First sale | $7,299,689 | $4,080 | — / — | 1,789 | $43,798 | — | |
| Mar 2016 | First sale | $6,006,512 | $3,357 | 2 / 2.5 | 1,789 | $36,039 | Plan | |
| Feb 2016 | First sale | $24,073,837 | $5,990 | — / — | 4,019 | $144,443 | — | |
| Feb 2016 | First sale | $7,248,777 | $4,052 | — / — | 1,789 | $43,493 | — | |
| Feb 2016 | First sale | $17,287,538 | $4,834 | — / — | 3,576 | $103,725 | — | |
| Feb 2016 | $16,676,588excluded from charts | — | 2 / 3.5 | 546 | Plan | |||
| Feb 2016 | First sale | $7,437,228 | $4,157 | 2 / 2 | 1,789 | $44,623 | Plan | |
| Feb 2016 | First sale | $5,965,782 | $3,335 | — / — | 1,789 | $35,795 | — | |
| Feb 2016 | First sale | $13,715,517 | $3,835 | — / — | 3,576 | $82,293 | — | |
| Feb 2016 | First sale | $16,371,113 | $4,578 | 3 / 3.5 | 3,576 | $98,227 | — | |
| Jan 2016 | First sale | $13,593,327 | $3,801 | — / — | 3,576 | $81,560 | — | |
| Jan 2016 | First sale | $7,401,514 | $4,137 | — / — | 1,789 | $44,409 | — | |
| Jan 2016 | First sale | $16,523,850 | $4,621 | — / — | 3,576 | $99,143 | — | |
| Jan 2016 | First sale | $16,218,375 | $4,535 | — / — | 3,576 | $97,310 | — | |
| Jan 2016 | First sale | $15,047,388 | $4,208 | — / — | 3,576 | $90,284 | — | |
| Jan 2016 | First sale | $14,894,650 | $4,165 | — / — | 3,576 | $89,368 | — | |
| Jan 2016 | First sale | $18,926,920 | $5,293 | — / — | 3,576 | $113,562 | — | |
| Dec 2015 | First sale | $7,735,785 | $3,684 | 2 / 2.5 | 2,100 | $46,415 | Plan | |
| Dec 2015 | First sale | $13,471,137 | $3,767 | — / — | 3,576 | $80,827 | — | |
| Dec 2015 | First sale | $5,233,794 | $3,681 | — / — | 1,422 | $31,403 | — | |
| Dec 2015 | First sale | $18,116,903 | $4,526 | 4 / 4.5 | 4,003 | $108,701 | Plan |
Every deed recorded in NYC ACRIS for the residential lots — actual closing prices, not asking prices. "Rebate at this price" is an illustrative estimate at that price under the current rebate terms; eligibility conditions apply.*
| Leased | Residence | Rent | $/SF/yr | Bd / Ba | Sq ft | Plan | |
|---|---|---|---|---|---|---|---|
| Sep 2026 | Furnished | $75,000/mo | $342 | 3 / 3 | 2,633 | Plan | |
| Jul 2026 | $85,000/mo | $254 | 3 / 5 | 4,019 | — | ||
| Jan 2026 | Furnished | $75,000/mo | $203 | — / — | 4,430 | — | |
| May 2025 | Furnished | $62,000/mo | $208 | — / — | 3,576 | — | |
| May 2025 | Furnished | $40,000/mo | $216 | 3 / 3 | 2,224 | — | |
| Nov 2024 | $70,000/mo | $209 | 4 / 4.5 | 4,019 | Plan | ||
| May 2024 | Furnished | $72,500/mo | $216 | — / — | 4,019 | — | |
| Jan 2024 | $79,000/mo | $236 | 4 / 4.5 | 4,019 | Plan | ||
| Nov 2023 | $70,000/mo | $209 | 4 / 4.5 | 4,019 | Plan | ||
| Jul 2023 | $75,000/mo | $202 | — / — | 4,462 | — | ||
| May 2023 | $68,000/mo | $203 | — / — | 4,019 | — | ||
| Apr 2023 | $27,500/mo | $184 | — / — | 1,789 | — | ||
| Feb 2023 | Furnished | $72,500/mo | $196 | — / — | 4,430 | — | |
| Dec 2022 | Furnished | $60,000/mo | $273 | 3 / 3 | 2,633 | Plan | |
| Dec 2022 | $60,000/mo | $179 | 3 / 4.5 | 4,028 | Plan | ||
| Mar 2022 | $27,000/mo | $154 | 2 / 2.5 | 2,100 | Plan | ||
| Feb 2021 | $15,000/mo | $101 | — / — | 1,789 | — | ||
| Oct 2020 | Furnished | $26,000/mo | $149 | 2 / 2.5 | 2,100 | Plan | |
| Aug 2020 | $29,500/mo | $198 | — / — | 1,789 | — | ||
| Apr 2019 | $49,500/mo | $226 | 3 / 3 | 2,633 | Plan | ||
| Jan 2019 | $70,000/mo | $209 | 4 / 4.5 | 4,019 | Plan | ||
| Oct 2018 | $31,000/mo | $167 | 3 / 3 | 2,224 | — | ||
| Jun 2018 | $85,000/mo | $254 | 4 / 4.5 | 4,019 | Plan | ||
| Mar 2018 | $31,500/mo | $170 | 3 / 3 | 2,224 | Plan | ||
| Mar 2018 | $60,000/mo | $201 | — / — | 3,576 | — | ||
| Feb 2018 | $26,500/mo | $178 | — / — | 1,789 | — | ||
| Jan 2018 | $57,000/mo | $170 | — / — | 4,019 | — | ||
| Dec 2017 | $64,000/mo | $172 | — / — | 4,462 | — | ||
| Sep 2017 | $78,000/mo | $232 | 3 / 4.5 | 4,028 | Plan | ||
| Jun 2017 | $60,000/mo | $179 | 4 / 4.5 | 4,019 | Plan | ||
| Feb 2017 | $45,000/mo | $205 | 3 / 3 | 2,633 | Plan | ||
| Sep 2016 | $55,000/mo | $164 | — / — | 4,019 | — | ||
| Sep 2016 | $55,000/mo | $164 | — / — | 4,019 | — | ||
| Apr 2016 | $25,000/mo | $168 | 2 / 2.5 | 1,789 | Plan |
Closed leases reported to the REBNY Listing Service — what tenants paid.
Live from the REBNY Listing Service via Cotality, Oct 2026. Rentals show the monthly rent and carry no rebate. Listing photos carrying brokerage branding are not shown.
Deeds recorded with the City of New York — actual closing prices, never asking prices.
Highest annual average: $6,864/SF in 2022. 2026 to date: $4,739/SF across 2 closings. Annual averages swing with the mix — a penthouse year reads high.
Of the 144 closings in 2015–2022, 118 were each residence's first recorded sale and 26 were early resales; since 2023 the building has recorded 1–9 closings a year.
163 closings plotted, from $1.25M to $87.7M. Larger residences generally trade higher.
Lowest: Residence 29P, 595 sf, $1,250,000 (Jul 2021). Highest: Residence 96, 8,255 sf, $87,660,898 (Sep 2016). Lowest and highest figures use arm's-length, single-residence deeds within the $/SF band below; small staff/storage units under 500 sf are excluded from every price range.
Source: NYC ACRIS recorded deeds for the 128 residential condominium lots, matched to DOF gross square feet. 163 closings charted. Not counted at all: 14 further deeds recorded with $0 consideration (outside the 169 priced deeds). Excluded from the charts: 29E (Oct 2024) — $/SF outlier ($1,489/SF vs 2023–2025 median $3,755); 28H (May 2022) — $/SF outlier ($962/SF vs 2021–2023 median $3,872); 28A (Jun 2020) — $/SF outlier ($1,465/SF vs 2019–2021 median $4,425); 28M (Jun 2020) — nominal consideration ($237,451) — not an arm's-length sale; 40C (Oct 2018) — $/SF outlier ($27,609/SF vs 2017–2019 median $4,853); 54C (Feb 2016) — $/SF outlier ($30,543/SF vs 2015–2017 median $4,605). Rules: deeds under $250K are treated as non-market transfers; a $/SF more than 3× or under 40% of the median of deeds within a year either side (or the building median, $4,557/SF, where that window is thin) is treated as an outlier; deeds to the condominium's own board of managers are not market sales.
| Year | Closings | Avg $/SF | Median $/SF | Avg price | Total volume |
|---|---|---|---|---|---|
| 2026 | 2 | $4,739 | $4,739 | $15.3M | $30.7M |
| 2025 | 1 | $4,097 | $4,097 | $14.7M | $14.7M |
| 2024 | 9 | $3,795 | $3,440 | $8.86M | $79.7M |
| 2023 | 7 | $4,641 | $4,182 | $16.5M | $115.2M |
| 2022 | 2 | $6,864 | $6,864 | $23.3M | $46.7M |
| 2021 | 6 | $4,118 | $3,206 | $13.9M | $83.6M |
| 2020 | 2 | $4,128 | $4,128 | $12.1M | $24.3M |
| 2019 | 12 | $5,249 | $4,816 | $19M | $228M |
| 2018 | 17 | $5,638 | $6,021 | $20.4M | $346.8M |
| 2017 | 21 | $5,221 | $4,170 | $21M | $440.9M |
| 2016 | 80 | $5,190 | $4,701 | $19.2M | $1533.6M |
| 2015 | 4 | $3,914 | $3,725 | $11.1M | $44.6M |
Download the full sales history: 432-park-avenue-sales.csv (169 recorded sales, NYC ACRIS).
128 residential lots on the NYC Department of Finance roll (block 1292), drawn to relative size. Sales: ACRIS recorded deeds. Layouts, listings and floor plans: REBNY Listing Service. Floors without residences (amenity / mechanical levels) are omitted.
432 Park Avenue sits on Billionaires' Row at the southern edge of the Upper East Side's retail corridor, steps from Madison Avenue's flagship stores and Fifth Avenue. Central Park is three blocks north.
The Four Seasons Hotel New York is across 57th Street, and the Plaza District's restaurants and galleries are within a short walk.
As of Oct 2026, 11 residences are available at 432 Park Avenue: PH88 ($88,500,000), 64 ($80,000,000), 84B ($67,000,000), 71A ($32,000,000), 71B ($32,000,000), 66B ($22,995,000), 54C ($22,800,000), 81A ($16,950,000), 35B ($15,000,000), 53B ($8,995,000), 39C ($7,800,000). Residences 71A and 71B are also offered together as a combined full floor, listed as Residence 71 ($64,000,000). Because that listing combines two residences already counted, it is not counted separately. Conquest can arrange private showings of any of them and represent you as the buyer; eligible new clients may receive 20% of Conquest's buyer-side commission back on purchases over $3.5M.*
Conquest arranges private showings of every available residence at 432 Park Avenue. WhatsApp +1 (201) 228-4688, call (646) 480-6095, or send the inquiry form on this page.
Conquest represents buyers at 432 Park Avenue with building-specific data: 163 recorded sales since 2015 and a median of $4,004 per square foot over the 24 months ending October 27, 2026. Eligible new clients may receive 20% of Conquest's buyer-side commission back on purchases over $3.5M.*
Conquest negotiates from every recorded closing since 2015: the median sale over the 24 months ending October 27, 2026 was $4,004 per square foot, while current listings ask a median of $6,438 per square foot, a 61% premium to recent closings. Eligible new clients may also receive 20% of Conquest's buyer-side commission back on purchases over $3.5M.*
432 Park Avenue has 128 residential condominium units on the NYC Department of Finance assessment roll as of Oct 2026 (Manhattan block 1292, lots 1301–1462). Source: NYC DOF roll.
432 Park Avenue, known as 432 Park, was designed by Rafael Viñoly, was completed in 2015, rises 85 floors and stands 1396 feet tall. It was developed by CIM Group & Macklowe Properties. Source: Conquest building file.
Yes. Each of the 128 residences is a separate condominium tax lot on the NYC DOF roll and is bought and sold by recorded deed; 169 priced deeds have been recorded since 2015. Source: NYC DOF roll, NYC ACRIS recorded deeds.
The median recorded sale over the 24 months ending October 27, 2026 was $4,004 per square foot across 4 closings, up 7% from the 2015 median of $3,725 per square foot. Source: NYC ACRIS recorded deeds and NYC DOF square footage.
The highest recorded sale is Residence 96 at $87,660,898, closed in Sep 2016 ($10,619 per square foot). Source: NYC ACRIS recorded deeds, as of Oct 2026.
2 sales were recorded in the 12 months ending October 27, 2026, ranging from $8,697,500 to $22,000,000. Source: NYC ACRIS recorded deeds.
Among current listings that report both common charges and real estate taxes, monthly carrying costs run from $13,222 (Residence 39C, 2,100 sq ft) to $50,165 (Residence PH88, 8,200 sq ft), as of Oct 2026. Source: REBNY RLS.
6 leases were signed in the 24 months ending October 27, 2026, at a median of $72,500 per month (range $40,000 to $85,000). Source: REBNY RLS closed leases.
3 leases were signed in the 12 months ending October 27, 2026, at a median of $75,000 per month; 34 closed leases are on record in total. 1 residence is listed for rent now. Source: REBNY RLS.
432 Park Avenue is in Midtown, Manhattan (ZIP 10022). The nearest subway is the 4/5/6 and N/R/W at Lexington Avenue/59th Street. Source: Conquest building file.
Conquest rebates 20% of its buyer-side commission to new clients on purchases (not rentals) over $3,500,000 with non-exclusive buyer representation, provided the rebate is requested in writing before the first showing; at an assumed 3% commission that is 0.6% of the price. At the building's median recorded sale price over the 24 months ending October 27, 2026, $11,673,750, the estimated rebate is $70,043. Actual commission and rebate depend on the transaction.
Get a private valuation built from every recorded closing in the building — 163 ACRIS sales, median $4,004/SF over the last two years — plus what listed comparables are asking today.
Your request has reached the Conquest team. We'll be in touch shortly.